|
Maps When Light
Rail Atlas entered the internet in 1998 basically the idea was to develop
a showcase of examples and best practices of existing, new or proposed
light rail systems. We presumed (and still do) that maps represent essential
information and knowledge regarding these systems and to some extend
the showcase was conceived as a real atlas, which explains the name
of this website.
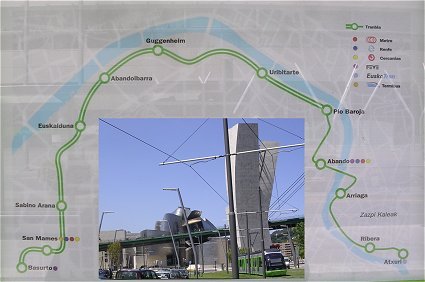
Photo-based
map of Bilbao's new tramway (Spain). The green line represents the tramway.
Double green means double track; single means single track; open dots
are stops. The tramway serves the central city which is vaguely mapped
by means of streets and blocks. The legibility of the tramway's urban
context is poor due to reflection in the glass in front of the map that
is framed in the 'abri'-structure of one the tram stops.
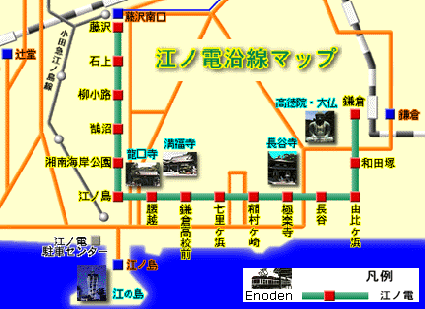
Schematic
map of the Enoden light rail in Japan. The green line shows the alignment
of the interurban style railway which officially is conceived as a tramway
due to the section of street running in the town centre of Enoshima.
The map schematically represents all types of public transport in this
area south of the Tokyo-Yokohama urban region. This is a typical Japanese
styled map as the many graphic signs and colourful lines clearly proof.
The orange lines depict bus services, while all other lines are dedicated
to heavy railways.
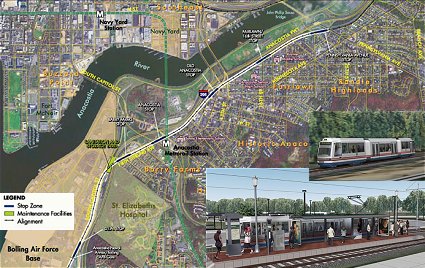
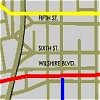
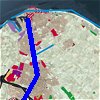
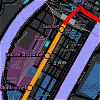
Map based on aerial view of a new tramway in Washington D.C., known as the Anacostia Light Rail Demonstration project on the east side of the Anacostia River. The alignment is marked as a thin dark line (on the map from down left to upper right). The six stops of this 4,34 km (2.7-mile) tramway are shown as darker stripes. We like this map as it clearly shows the tramway's context: elements of its urban environment and related road and rail infrastructure, such as one of Washington's subway lines (in green).
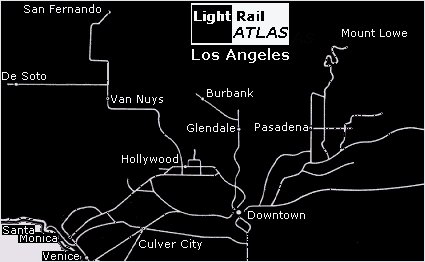
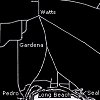
Line-based map of the historic 'Pacific Electric' of Greater Los Angeles. Once upon a time the PE operated a 1.164 miles network. However, the last survivor line closed in 1961. All lines are marked as white lines. We made this map as part of our ongoing study of the Los Angeles' urban system. The map is based on the famous research of Reyner Banham, published in his book 'Los Angeles. The Architecture of Four Ecologies' (1971). The map put here is a section only, showing the central portion of the system: downtown LA, Hollywood, Culver City and the beach. The original map is composed of five sections. Line-based
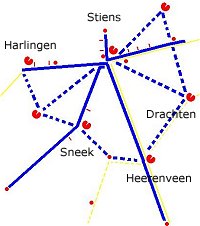
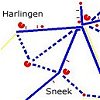
map of a network study assigned by province of Friesland, Netherlands
(RVDB/Lightrail.nl, 2004). The blue lines represent proposed light rail
services on existing railways in Friesland (Fryslân). The dotted
blue lines depict additional bus services.
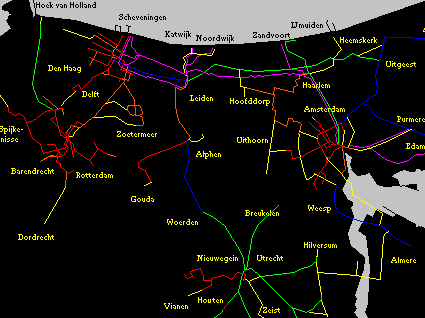
Our
map of light rail in The Netherlands, which is used on the Dutch section
of Light Rail Atlas to present all systems and schemes. This is clearly
a line-based map, but the key's colour code is specially designed
to address light rail characteristics. The first version of the map
was published in 1998.
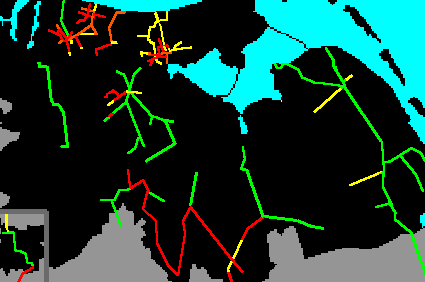
Detailed section of our map of light rail in The Netherlands, showing a dense network in the western part of Holland, using the same key as the overview (see previous). The publication of this map early 1998 marked the installation on internet of Light Rail Atlas.
Draft version of the previous map, made 1997, based however on a large series of analogue maps created in the Stone-Age epoch of LRA, long before internet or even computers became common practice.
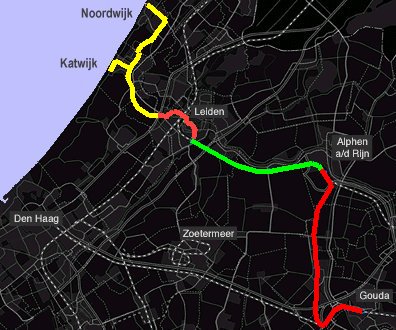
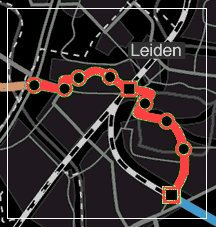
Again a Dutch map, now zooming in on the catchment area of the planned 'RijnGouweLijn' (RGL), located in the central part of Holland, south of Amsterdam, north of The Hague and Rotterdam. The map's background is created by schematizing an existing topographic map. The first section of the light rail line (in red) between Gouda and Alphen is in operation since 2003, using the existing heavy rail. The proposed connection to Leiden will make use of heavy rail too (in green), as well as a new tramway alignment (in orange) through the city of Leiden. Phase 2 of the project (in yellow) will involve a connection to the coast. RGL was Holland's 'Tram-Train' example scheme.
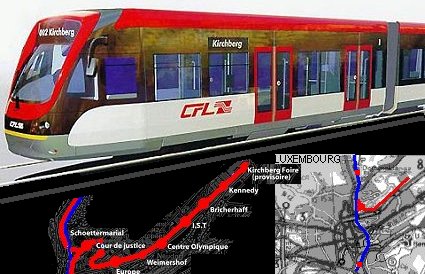
Using
the LRA-key of the previous maps this map shows the 'Tram-Train' scheme
of Luxembourg, a new urban-regional light rail-project, which includes
services on existing railway (inset, blue) and on new tramway (inset,
red) through the 'European' district of Kirchberg, northeast of the
city. The applied background (inset) is scanned from a tourist road
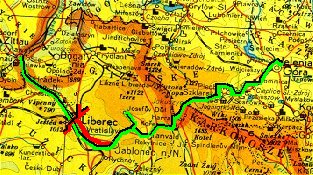
map. Again
a map using the LRA-key: the project of Liberec, located in the north-western
boarder region of the Czech Republic. Liberec's classic, narrow gauge
tramway will be upgraded and converted to standard gauge (in red). Existing
heavy railway (in green) will be upgraded too and used to extend the
tram into the region.
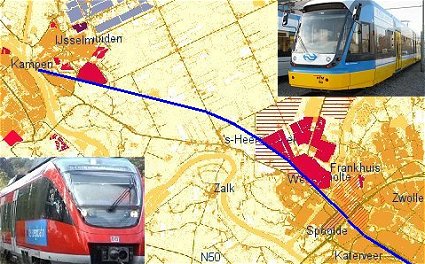
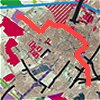
Map
of an existing railway in The Netherlands (in blue) between the city
of Zwolle and a town called Kampen. An advanced background is used,
showing existing urban areas (in darker brown) and new housing areas
(in red). We like this map, as it reveals the potential of this old
railway due to its intelligent overlay of the railway's alignment and
the spatial developments within the railway's context.
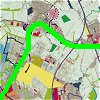
Map of an extension (in orange) of the existing tramway (in red) of Lyon (France). According to the project's map (2003) line T1 was planned to connect the Perrache terminus via Cours Charlemagne (locally 'Cours' means 'Avenue') to an urban renewal district, located on a peninsula south of the central city. We made this map by making a negative version of the official project-map (including its background) and by colouring the tramway alignment according to our own codes. Back
to the maps here...
Essentially the key of a map determines its purpose and objective. The maps within the showcase of Light Rail Atlas (and within the professional domain of Lightrail.nl too) have been equipped with a series of different keys. On the second part of this page we try to explain them all.
Key:
opportunistic 1
Key:
opportunistic 2
Key: 'LRA 1998'
Key:
'LRA improved'
Key:
Use-based representation
|
|
Key
Click here... for our manual of the map key. |